
NRK journalists Karina Kaupang Jørgensen (43) and Tuva Skog Christiansen (25) conclude that the average inhabitant of Norway is a net-negative citizen who, from cradle to grave, costs the state a net amount of 10 million kroner. NRK has thus moved the public debate back 13 years.
“Here is the price tag on your life,” NRK reported on 16 April. The journalists Karina Kaupang Jørgensen (43) and Tuva Skog Christiansen (25) had done the calculations. In a report illustrated with Lego bricks, dummies, toy animals and Playmobil figures, it is concluded that each of us costs the state 30 million kroner from birth to burial. The message was repeated throughout the day across all of NRK’s platforms.
The calculation they presented in the case shows that a man costs 28.2 million kroner, while a woman costs as much as 31.7 million kroner. This is partly offset by the fact that the man pays almost 26 million kroner in taxes and duties, while the woman pays just under 14 million.
In summary, NRK thus claims that the average inhabitant is a net-negative citizen who over the course of a lifetime costs the state a net 10 million kroner. NRK thereby moves the debate 13 years back in time. At that point, journalist Tuva Skog Christiansen was only 12 years old.
Up until then, the red–green government and Civita used the oil-adjusted deficit on the state budget (which is covered by the use of oil revenues) as proof that everyone ran at a deficit, as NRK now again claims.
What changed the narrative at that time was the article series “Innvandringsregnskapet” (The Immigration Accounts) in Finansavisen.
Norwegian children are good business
In the article “Norwegian children are good business”, published in Finansavisen on 10 May 2013, economist Erling Holmøy, who is a senior researcher at Statistics Norway (Statistisk sentralbyrå, SSB), stated: “Our figures show that over the calculation period the state will benefit if R0 (Norwegians) have more children.”
Translated into everyday language, this means: If Norwegians have more children, public finances will be strengthened in the future, given SSB’s model.
Statistics Norway categorises the population into different groups: R0, R1, R2 and R3.
R0 is the majority population, without an immigrant background, i.e. those who have grandparents born in the country. R1 has a background from Western Europe, North America, Australia and New Zealand; R2 consists of former Eastern Bloc countries that became EU members in 2004; and R3 is the rest of the world, also referred to as non-Western immigrants.
What NRK omits
There are substantial differences in the fiscal impact of these groups. It is therefore worth recalling SSB’s statement in the publication Samfunnsspeilet (The Social Mirror), issue 5/2013:
The major fiscal differences between the groups are directly linked to how much they contribute in tax revenues and how much they consume in public goods.
Based on SSB’s model, Finansavisen concluded that an average non-Western immigrant entails a net cost obligation, which is the present value of future net costs.
In Samfunnsspeilet, SSB wrote:
SSB explains the deficit
However, as early as 2015, SSB had to revise the net cost upwards, since all integration costs had been omitted, or more precisely: distributed across the entire population, which is incorrect, insofar as they belong to those who consume integration costs such as asylum reception centres, introduction programmes, Norwegian language courses, etc., and not least housing and living costs in host municipalities.
Furthermore, SSB made a simplified assumption that the consumption of public welfare services was evenly distributed and that Norwegian-born descendants are perfectly integrated. In the SSB report “Macroeconomics and public finances in different scenarios for immigration” (PDF), on page 10, this assumption is described as “debatable”.
In the attached case, SSB researchers’ description of a more realistic approach is cited:
It was requested that the following quotation not be printed in Finansavisen, as it could have consequences for the researchers.
This sentence makes clear that the oil-adjusted deficit on the state budget, which is growing and must be covered by ever-increasing use of oil revenues, can be linked to the growing non-Western immigrant population in Norway.
The following figure shows the development of the oil-adjusted deficit on the state budget as a percentage of the budget, since the Oil Fund was established, and the share of the non-Western population.
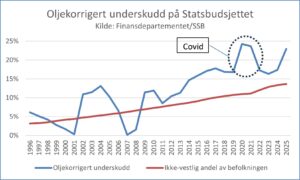
Oil-adjusted deficit as a percentage of the expenditure side of the state budget and share of the non-Western immigrant population. Source: Ministry of Finance, SSB
Low contribution and high consumption
In the NRK case, the tax-financed benefits received over the life course and how much men and women respectively contribute in taxes are summarised. The net result of this is negative on average and is by definition “the oil-adjusted deficit” on the state budget. That is to say: what the deficit on the state budget would have been if it had not been covered by the use of oil revenues.
However, the deficit is not evenly distributed. As SSB expresses, and as shown in Finansavisen’s article series “Innvandringsregnskapet”, and in articles published by Document, the deficit is largely linked to the non-Western immigrant population’s lack of tax contribution and higher consumption of tax-financed welfare services.
In the following articles, Document examines this in greater detail.
Working-age immigrants receive 74% of Norway’s social welfare benefits
and
Blaming the elderly: How they’re hiding the real welfare scandal